How to Use a Risk Impact Matrix to Prioritize Risks

When taking on any business project or new opportunity, there is risk involved. The ability to visualise risk and use the depiction to mitigate risk is a helpful tool to have. This is what a risk impact matrix offers. We’ll cover how to create a probability and impact matrix, the benefits of using one, as well as share some best practices.
Coming Up
1. What is a Risk Impact Matrix?
2. Steps to Create a Risk Impact Matrix
3. Detailed Examples of Risk Matrices
4. Risk Efficiency Measurement
5. Challenges of Using Risk Matrices
6. Best Practices and Lessons Learned
What is a Risk Impact Matrix?
Definition and Importance
A risk impact matrix, also known as a risk assessment matrix, is a powerful tool that combines the probability and impact scores of each identified risk and ranks them in terms of priority for management. This visual representation is crucial in risk analysis and project management.
The matrix typically uses either a 3x3 or 5x5 grid. In a 3x3 matrix, the scale for both probability and impact includes Low, Medium, and High. A 5x5 matrix offers more granular descriptors: Very Low, Low, Medium, High, and Very High for both probability and impact.
Along the axes, probability can be defined as rare, unlikely, moderate, likely, or very likely. For impact, options may include trivial, minor, moderate, major, and extreme. These descriptors populate the cells within the matrix, providing a clear visual guide for risk assessment.
Benefits of Using a Risk Impact Matrix
When designed and implemented properly, a risk impact matrix offers several key benefits:
- Visualizing Risks: Provides a graphical representation of risks based on project or task, making it easy to understand the overall risk landscape.
- Prioritizing Risks: Helps identify event outcomes that require further investigation and pinpoint areas where risk reduction is possible.
- Simplifying Risk Management: Simplifies the overall process of risk management, making it more accessible and actionable.
- Enabling Detailed Analysis: Provides a foundation for more detailed analysis in high-risk situations when needed.
- Supporting Decision-Making: Assists in making informed decisions about risk responses and resource allocation.
In the context of financial teams and business decisions, risks are inevitable. The necessity of adequate risk management plays a large role in a company's success. A well-constructed risk impact matrix is an essential component of this process.
Finance teams can leverage automation tools to assist in risk management. This approach first requires the team to define and identify risks, then set up parameters for control based on their risk mitigation strategy.
Automation tools can help alert the team if any thresholds are met, and if a process needs to be initiated in response, it can be done automatically. These tools help to centralize and standardize the risk assessment and mitigation process. Furthermore, since the entire organization will be working with the same tool, it becomes easier to pull reports and oversee how the business is managing its risk profile.
By utilizing a risk impact matrix in conjunction with automation tools, organizations can enhance their ability to identify, assess, and mitigate risks effectively, leading to more informed decision-making and improved project management outcomes.
Steps to Create a Risk Impact Matrix
Creating an effective risk impact matrix involves four key steps. Let's explore each in detail:
1. Identify Risks
The risk identification process is crucial for developing a comprehensive risk impact matrix:
- Involve team members from various departments to gather diverse perspectives.
- Conduct brainstorming sessions to identify potential risks (e.g., financial, operational, strategic).
- Use techniques such as SWOT analysis, historical data review, and expert interviews.
- Categorize identified risks into groups (e.g., technology, market, operational).
- Create a risk register to document all identified risks.
Example: In a software development project, risks might include scope creep, technical challenges, or resource constraints.
2. Analyze Risks
Risk analysis involves both quantitative and qualitative methods:
Quantitative Analysis:
- Assign numerical probabilities to each risk (e.g., 0.1 to 0.9).
- Estimate potential financial impact in currency values.
- Use tools like Monte Carlo simulation for complex scenarios.
Qualitative Analysis:
- Use descriptive scales (e.g., Very Low, Low, Medium, High, Very High) for probability and impact.
- Consider factors like urgency and proximity of the risk.
- Conduct interviews or surveys with stakeholders to gather expert opinions.
3. Assess Risk Impact
Assessing risk impact helps understand the potential consequences of each risk:
- Develop a standardized impact scale (e.g., 1-5 or 1-10).
- Define criteria for each level of impact (e.g., 1 = minimal financial loss, 5 = significant reputational damage).
- Consider multiple dimensions of impact:
- Financial: Potential monetary losses
- Operational: Disruption to business processes
- Reputational: Damage to brand image
- Legal/Compliance: Regulatory consequences
- Use a matrix to combine probability and impact scores.
Example: A data breach might have a medium probability (3/5) but a high impact (5/5) due to potential financial and reputational damage.
4. Prioritize Risks
The final step involves using the risk impact matrix to prioritize risks and develop mitigation strategies:
- Plot risks on the matrix based on their probability and impact scores.
- Identify high-priority risks (typically in the top-right quadrant of the matrix).
- Develop risk response strategies for high-priority risks:
- Avoid: Eliminate the threat or protect against its impact
- Transfer: Shift the risk to a third party (e.g., insurance)
- Mitigate: Reduce probability or impact of the risk
- Accept: Acknowledge the risk but take no action (for low-priority risks)
- Allocate resources based on risk priorities.
- Regularly review and update the matrix as new information becomes available or project circumstances change.
Example: For a high-priority risk like potential supply chain disruption, a mitigation strategy might involve diversifying suppliers and maintaining larger inventory buffers.
By following these steps, project managers and risk analysts can create a robust risk impact matrix that enhances decision-making and improves overall risk management in project and business contexts.
Detailed Examples of Risk Matrices
Risk matrices are essential tools for visualizing and prioritizing risks. They come in various sizes, with 3x3, 4x4, and 5x5 being common formats. Each size offers different levels of detail in risk assessment.
When using risk matrices, organizations typically assign a "Risk Score" to each identified risk. This score is generally calculated by combining the risk's probability and impact ratings. The most common method is to multiply these two factors, though some organizations may use addition or more complex formulas.
It's important for each organization to clearly define and document their risk scoring methodology. This should include:
- How likelihood and impact are rated
- The method for calculating the final risk score
- Any additional factors considered (e.g., risk velocity or detectability)
- Thresholds for different risk levels (e.g., low, medium, high)
Some organizations may also apply weighting to certain risk categories or factors based on their specific context or priorities. Whatever approach is chosen, it should be consistently applied and regularly reviewed to ensure it remains relevant and effective.
Let's explore examples of different risk matrices and how they can be applied to real-world scenarios:
3x3 Risk Matrix
A 3x3 risk matrix is simple and easy to use, making it ideal for smaller projects or quick assessments.
Example:
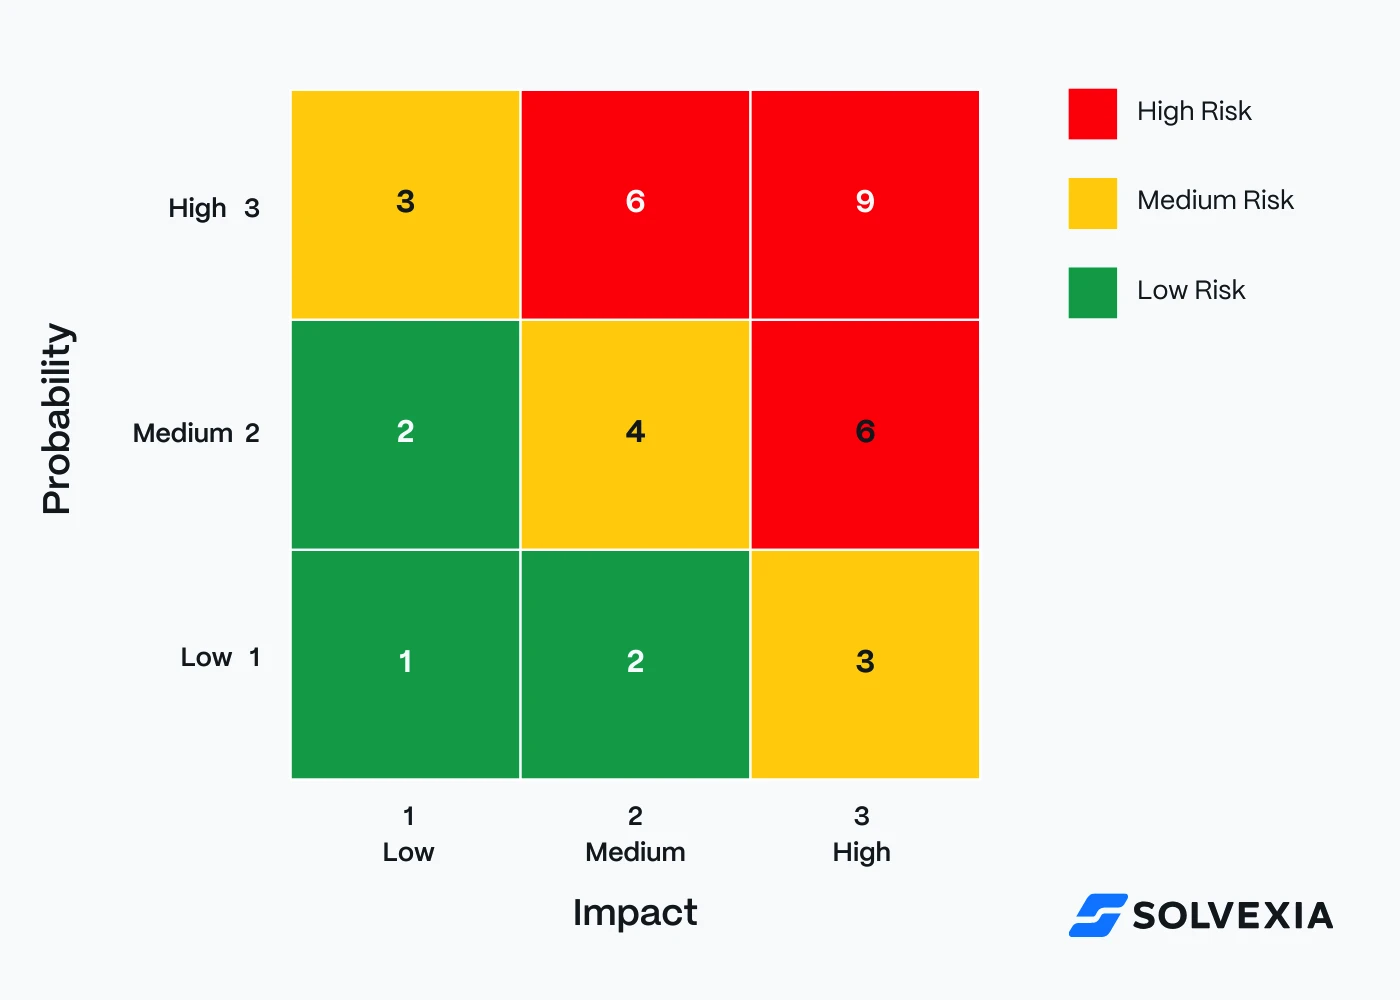
Real-world scenario: A small IT company is launching a new software product.
- Risk: Delay in product launch
- Probability: Medium
- Impact: High
- Risk score: 6 (High risk)
4x4 Risk Matrix
A 4x4 matrix offers more nuance than a 3x3 but is still relatively simple.
Example:
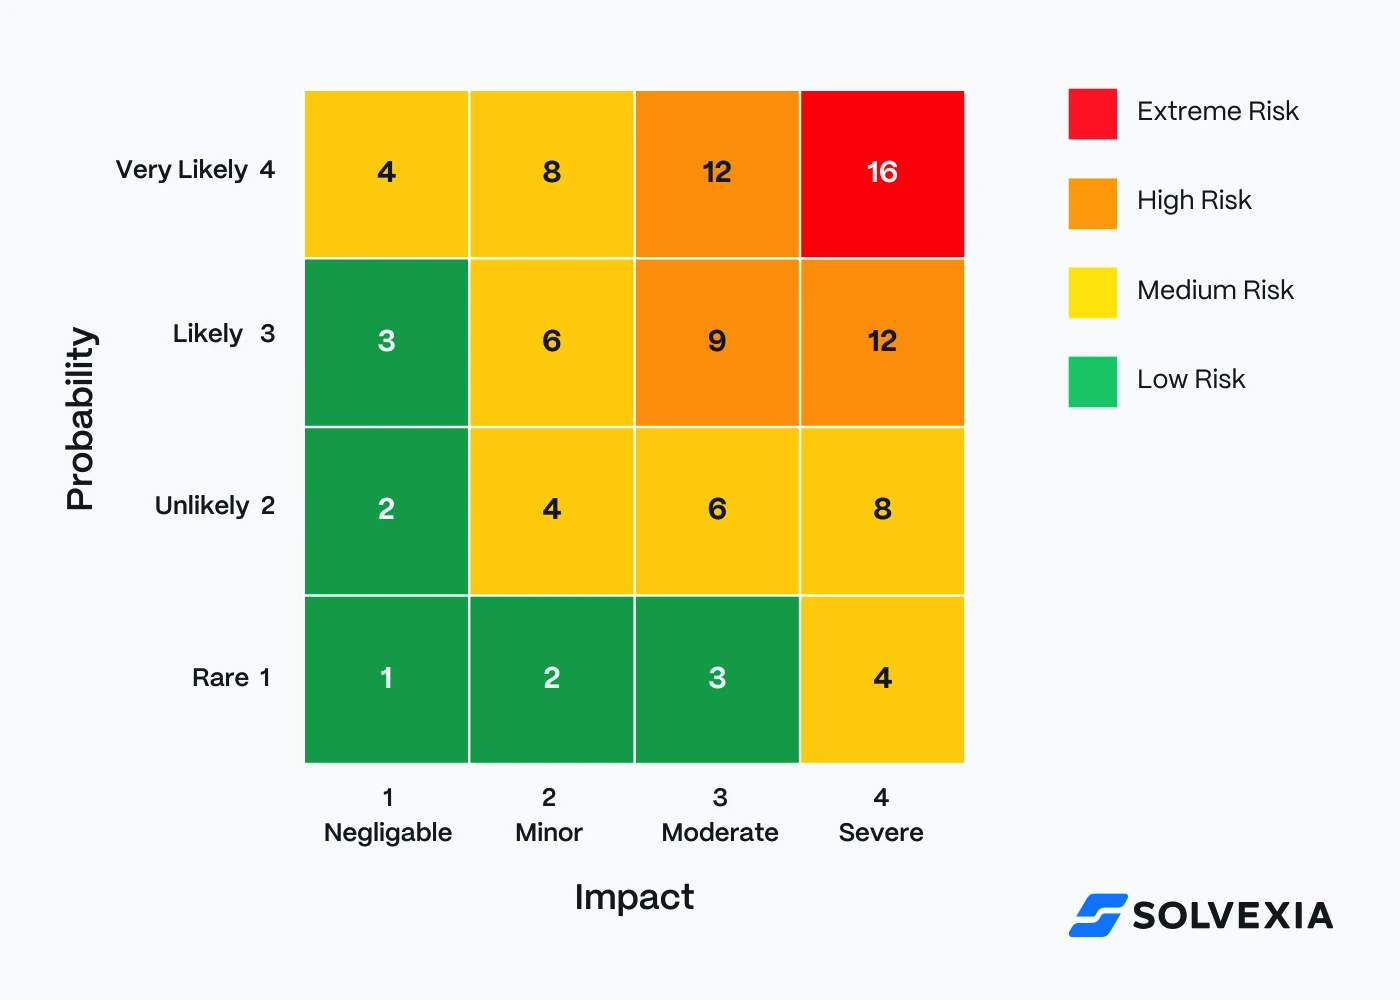
Real-world scenario: A construction company is building a new office complex.
- Risk: Worker injury due to equipment malfunction
- Probability: Unlikely
- Impact: Severe
- Risk score: 8 (Medium risk, but close to high)
5x5 Risk Matrix
A 5x5 matrix provides the most detailed risk assessment among these options.
Example:
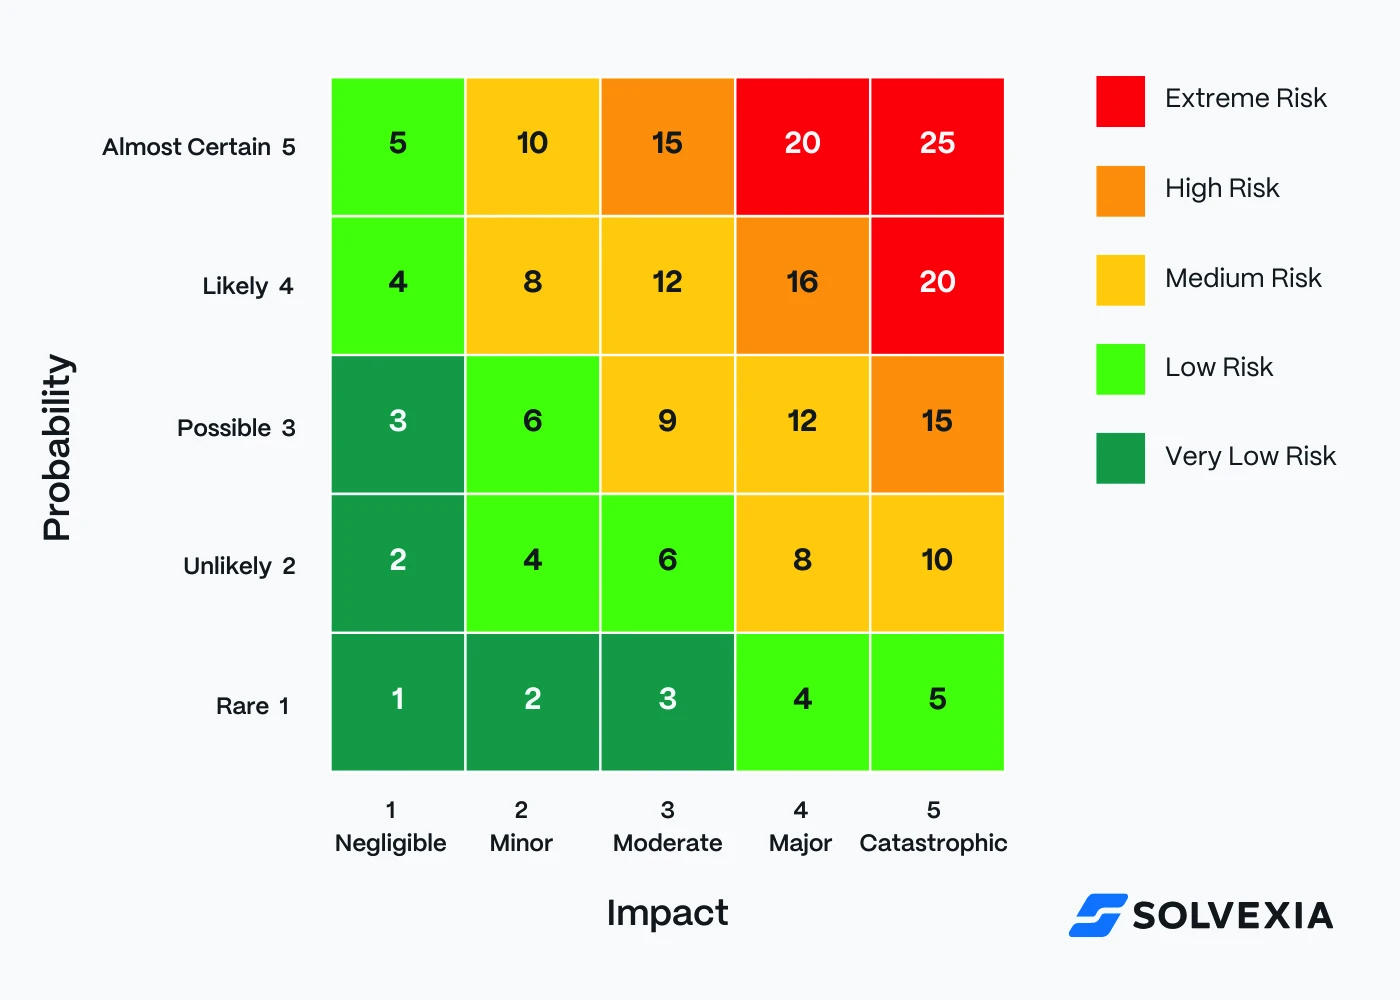
Real-world scenario: A multinational corporation is implementing a new ERP system.
- Risk: Data breach during system migration
- Probability: Unlikely
- Impact: Catastrophic
- Risk score: 10 (Medium risk, but requires careful attention)
How to Use These Matrices:
- Identify potential risks in your project or business operation.
- Assess each risk's probability and potential impact.
- Plot the risk on the matrix to determine its severity.
- Prioritize risks based on their scores, focusing on high and extreme risks first.
- Develop mitigation strategies for each risk, especially those with high scores.
- Regularly review and update the risk assessment as the project or business environment changes.
Remember, while these matrices provide a structured approach to risk assessment, they should be used in conjunction with expert judgment and tailored to your specific context. The goal is to create a clear, actionable view of your risk landscape to inform decision-making and resource allocation.
Risk Efficiency Measurement
Risk mitigation and management evolves as the business changes. That's why it's useful to track how well your business is managing the impact of risk. This can be done through two main methods:
Risk Audit
A risk audit is an independent measurement of risk efficiency. It provides valuable insights into:
- How well risks are being identified
- The correlation between project risks and organizational risks
- The effectiveness of mitigation plans that have been put into place to manage risks
Technical experts conducting risk audits typically provide businesses with:
- Important areas to focus on for risk analysis based on a given project
- Potential risks that were missed but exist
- A customized checklist to evaluate risks
- Identification of risk-prone areas
Risk audits help ensure that risk management principles are being effectively applied and can highlight areas for improvement in the risk management process.
Risk Metrics
Risk metrics involve ongoing analysis as a project rolls out and after it closes. These metrics evaluate how well the risk mitigation plan is working in action and serve as historical insights for future projects. Key risk metrics to track and quantify include:
- Number of risks that occurred during the project
- Number of risks identified
- Comparison of actual risk impact against expectations
- Discrepancies between anticipated risks and actual problems encountered
Additional metrics to consider:
- Risk mitigation success rate
- Cost of risk management vs. cost savings from avoided risks
- Time spent on risk management activities
- Frequency of risk reassessment
By consistently measuring these metrics, organizations can:
- Assess the effectiveness of their risk management strategies
- Identify trends in risk occurrence and impact
- Improve future risk assessments based on historical data
- Justify investments in risk management processes
Regularly reviewing these risk efficiency measurements allows businesses to continuously refine their risk management approach, ensuring it remains relevant and effective as the business landscape evolves.

Challenges of Using Risk Matrices
While risk matrices are valuable tools for risk management, they come with certain limitations and challenges that organizations should be aware of:
- Subjectivity in Risk Assessment: The process of assigning likelihood and impact ratings can be highly subjective. Different individuals or teams may interpret risks differently, leading to inconsistent assessments.
- Oversimplification of Complex Risks: Risk matrices tend to reduce complex risks to simple numerical values or color codes. This simplification, while useful for quick decision-making, may not capture the full nuance or context of certain risks.
- False Sense of Precision: The numerical scores generated by risk matrices can create an illusion of precision that may not reflect the inherent uncertainties in risk assessment.
- Difficulty in Comparing Dissimilar Risks: Risk matrices may not provide a clear way to compare risks across different categories or domains, potentially leading to misallocation of resources.
- Static Nature: Risk matrices provide a snapshot of risks at a specific point in time. Without regular updates, they can quickly become outdated in dynamic business environments.
- Potential for Bias: The design of the matrix itself (e.g., the number of categories or the thresholds between risk levels) can introduce bias into the risk assessment process.
- Overlooking Low Probability, High Impact Events: The matrix format may lead to underestimating rare but potentially catastrophic events, as they may fall into lower risk categories due to their low probability.
- Challenges in Aggregating Risks: Risk matrices typically assess individual risks but may not effectively represent how multiple risks interact or compound.
To mitigate these challenges, organizations should:
- Provide clear guidelines and training for risk assessment
- Regularly review and update their risk matrices
- Use risk matrices as one tool among many in a comprehensive risk management approach
- Encourage discussion and qualitative analysis alongside the quantitative assessments
- Be aware of the limitations and communicate them clearly to stakeholders
By acknowledging and addressing these challenges, organizations can make more effective use of risk matrices while avoiding potential pitfalls.
Best Practices and Lessons Learned
A company’s appetite for risk will depend on many variables. In the same vein, the approach to risk management and mitigation is bound to change over time. Some best practices and lessons to keep in mind when building your own risk matrix are:
- Tailor the assessment: Be sure to use tools that are suitable for the analysis in your risk assessment process. For example, if you’re dealing with an organisational change, then it may be worthwhile to consider the impact of risk on technology, cost and timing. You’ll want to be sure that the way by which you assess risk falls in line with the overall business goals or task at hand.
- Document everything: For each impact and probability rating, you’ll want to document the reasoning behind it. This is because you’ll revisit the risk matrix depending on both internal and external factors, so if any variable has changed, you’ll understand the thought process behind decisions.
- Prioritise the approach: Each risk will come with its own level of prioritisation. If a risk is critical and can negatively impact the entire organisation, then it should take precedence over less critical risks. Your risk mitigation strategy depends on the level of risk, as well as the goals you want to achieve.
By implementing an automation tool, you can alleviate some of the burden that comes along with risk management. With this tool and a risk impact matrix you’ll be able transform data for valuable insights, collaborate across an organisation effectively, standardise approaches and monitor risk using real-time data analytics.
FAQ
Recommended for you

Request a Demo
Book a 30-minute call to see how our intelligent software can give you more insights and control over your data and reporting.

Reconciliation Data Sheet
Download our data sheet to learn how to automate your reconciliations for increased accuracy, speed and control.

Regulatory Reporting Data Sheet
Download our data sheet to learn how you can prepare, validate and submit regulatory returns 10x faster with automation.

Financial Automation Data Sheet
Download our data sheet to learn how you can run your processes up to 100x faster and with 98% fewer errors.
Financial Automation Data Sheet
Download our data sheet to learn how you can run your processes up to 100x faster and with 98% fewer errors.
Financial Automation Data Sheet
Download our data sheet to learn how you can run your processes up to 100x faster and with 98% fewer errors.
Financial Automation Data Sheet
Download our data sheet to learn how you can run your processes up to 100x faster and with 98% fewer errors.
Financial Automation Data Sheet
Download our data sheet to learn how you can run your processes up to 100x faster and with 98% fewer errors.
Financial Automation Data Sheet
Download our data sheet to learn how you can run your processes up to 100x faster and with 98% fewer errors.

Rebate Management Data Sheet
Download our data sheet to learn how you can manage complex vendor and customer rebates and commission reporting at scale.

Top 10 Automation Challenges for CFOs
Learn how you can avoid and overcome the biggest challenges facing CFOs who want to automate.